
The second 2021 meeting that the IMF and the World Bank hold every six months in Washington took place in mid-October. While the prices of energy and major commodities had yet to take off, the tone was already grim. The presentation of the Global Financial Stability Report of October 2021 by a member of the IMF secretariat speaks of a “hobbled” world economy, hobbles being pebbles in one’s shoes or underfoot.1 The organization's concerns are frankly set out in the executive summary of the report itself:
“ Despite some improvements since the April 2021 Global Financial Stability Report, financial vulnerabilities continue to be high in a number of sectors, partly masked by massive stimulus measures. The deciders face a challenge: to maintain their short-term support to the global economy while avoiding unintended consequences and risks to financial stability in the medium term. A prolonged period of extremely easy financial conditions, while necessary to support the economic recovery, can lead to overly strained asset valuations and could fuel financial vulnerabilities (emphasis added). Some warning signs - for example, increased financial risk-taking and growing fragility in the non-bank financial institutions sector - point to a deterioration in the underlying foundations of financial stability. Left unchecked, these vulnerabilities could become legacy structural problems, jeopardizing medium-term growth and straining the resilience of the global financial system.”2
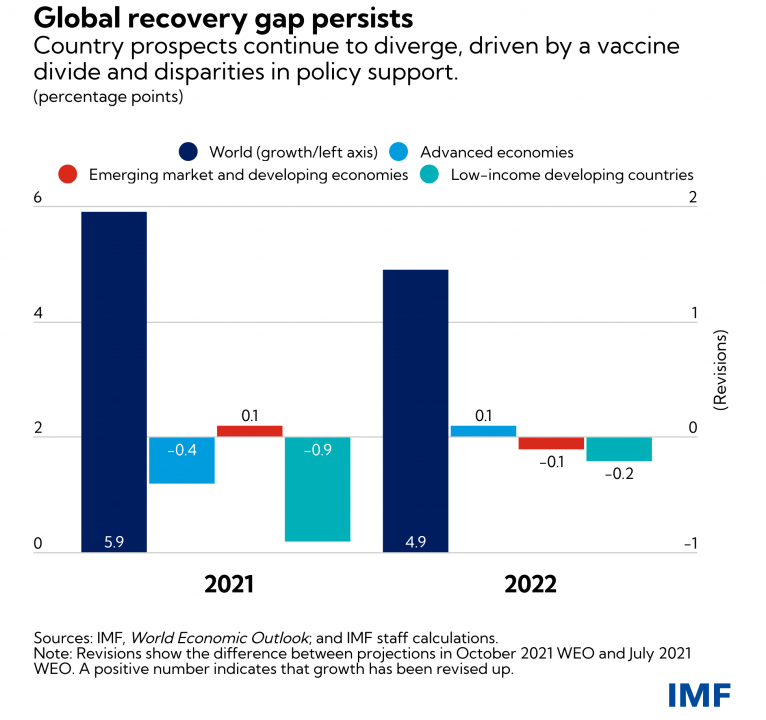
Graph 1
Global GDP growth projections
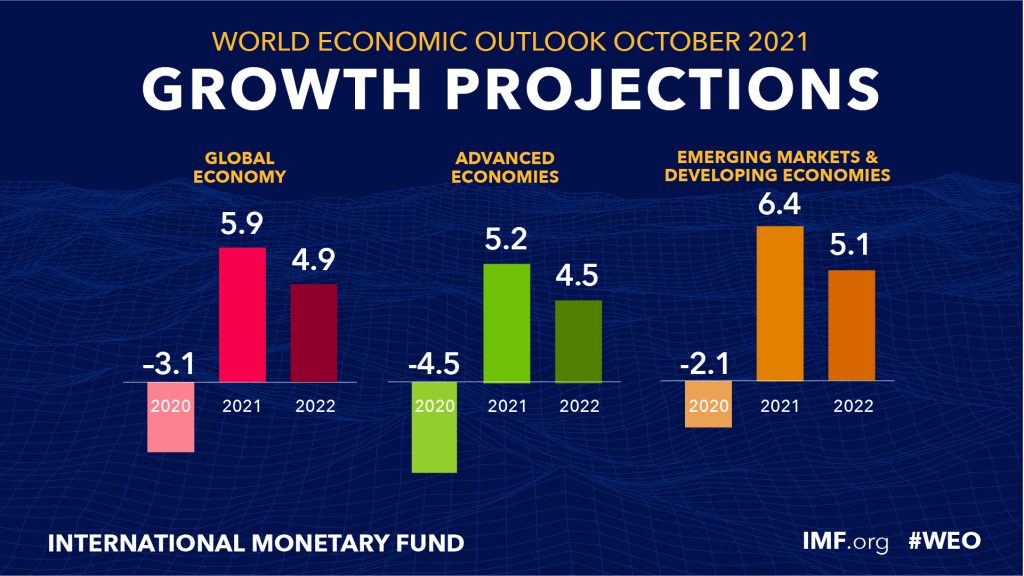
The rebound in the growth rate of world GDP between 2020 and 2021 will be halted, according to projections, in 2022, in particular due to the performance of advanced capitalist economies (in green in graph 1 above). On the eve of the Washington meetings the estimate made for 2021 was lowered from 6 per cent to 5.9 per cent. “The downward revision for 2021 reflects a downgrade for advanced economies - in part due to supply disruptions - and for low-income developing countries, largely due to worsening pandemic dynamics ”. What has been analyzed for France, namely that "far from the formidable recovery touted everywhere, we see that once past the fairly mechanical effects of the recovery, a form of stagnation”3 applies to all advanced capitalist countries.
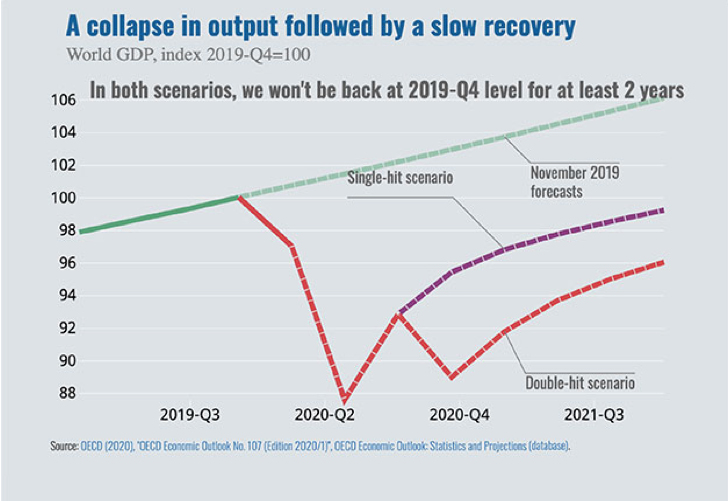
As the second wave of the pandemic loomed, the OECD released a chart with an estimate of both the “double-hit” and the time needed to return to the previous level of GDP. Will we soon have to draw the curve of a “treble-hit”?
Graph 2
A collapse in production followed by a slow recovery
The state of stagnation, which is now combined with soaring prices of raw materials, is all the more glaring when one takes into account the massive support from central banks to governments, as demonstrated by the Fed.
Graph 3
Purchases of Treasury bills by the Fed
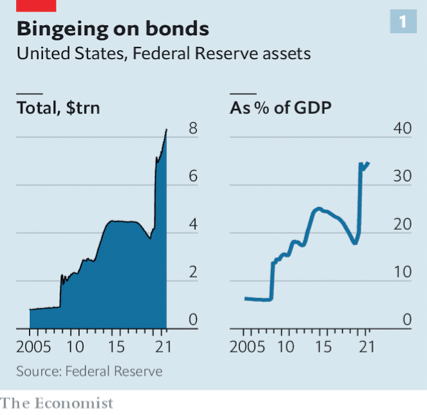
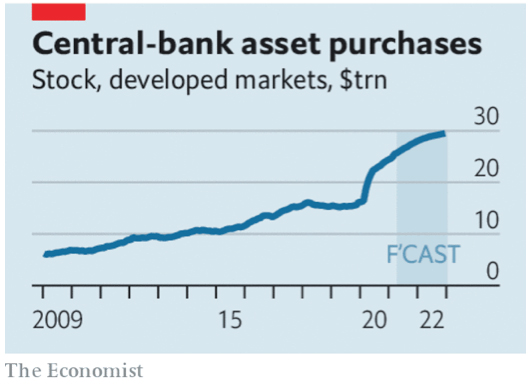
Chart 4 recalls that, like the Fed, all the central banks of the G7 countries have actively pursued a monetary policy of purchasing public debt securities and allowed governments, including those in the euro zone, to finance measures to support their economies.
Graph 4
Purchases of securities by central banks
In the case of France, the study that the OECD has just published on economic and social policy [[OECD, {OECD Economic Studies: France 2021}, pages 5 and 6.]] avoids the most sensitive subjects - nuclear power, arms sales - but it puts its finger on several points which reflect the Macron government’s fear of mobilization of the working-class. It first noted the importance of public support measures intended to limit the economic and social shock of the pandemic. “Since 2020, the partial activity scheme has preserved employment and household income. The solidarity fund, tax deferrals and state guaranteed loans have supported corporate liquidity and margins, reducing bankruptcies. Direct budgetary aid to economic activity reached 3.1 per cent of GDP in 2020 and 4.1 per cent in 2021. ”The report then notes the postponement of measures on issues where large-scale mobilizations were foreseeable. The OECD therefore reminds the government that “further reforms of the pension system are needed. The effective exit age from the labour market is the second lowest in the OECD, which is detrimental to potential growth. At the same time, life expectancy at age 65 is the second highest in the OECD. Another call to order: "a strategy of stabilization and gradual reduction of public debt is necessary to bring it back on a sustainable path, given the expected increase in aging-related spending. The level of public expenditure is high, and some expenditure is inefficient. School results largely reflect the students' family background, and significant research and development (R&D) aid does not translate fully (sic) into business innovation."
Another slightly more decomposed IMF chart shows the change from + 0.1 per cent in 2021 to -0.1 per cent in 2022 for emerging economies and from -0.9 per cent in 2021 to -0.2 per cent in 2022 .
Graph 5
Divergences in the global recovery persist
Both the Washington institutions and the OECD fear a third wave of the pandemic. They gave their support to the WHO in warning of the dangers of the yawning vaccination gap between OECD countries and so-called "emerging" countries (mainly China) on one hand and the rest of the world on the other (Chart 6). They were careful not to speak out in favour of the lifting of patents, to which the countries of origin, particularly European countries (Germany, Switzerland, France), of the major pharmaceutical groups are radically opposed.
Graph 6
Two contrasting situations in terms of access to vaccines
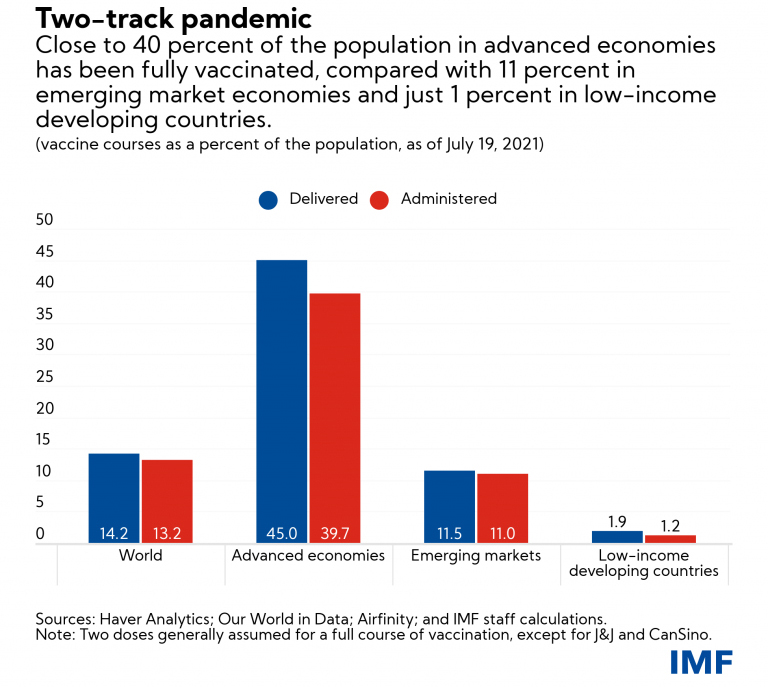
The consequences of this global divergence in access to vaccines are well-known. It was in India first and now in South Africa (Omicron) that the new mutant forms of Covid-19 have appeared.
The massive issuance of Treasury bills and their purchase by central banks have contributed to a further increase in financial assets constituting fictitious capital, accompanied by a very strong surge in real estate. Financial assets are fictitious capital. The term refers to the economic nature of the securities resulting from loans to governments or companies or from the financing (most often initial) of the capital of companies. Securities - bonds and equities - open rights (more exactly claims since rights can disappear in the event of a crash) to participate in the sharing of the profits of firms or to draw on, through the service of the public debt, income resulting from taxes. In this sense, securities are very real but, seen from the angle of the movement of capital productive of value and surplus value, they are not capital. At best, they are the memory” of an investment already made. Their holders see in them a "capital" from which they expect a regular return in the form of interest and dividends (a "capitalization") by the withdrawals on value which they authorize, as also by the fictitious profits resulting from successful speculative operations in financial markets.
Since 1994, the company McKinsey Global Institute has calculated the difference between the growth rate of financial assets and that of world GDP and has followed its evolution in successive studies published in 2009, 2011 and 2013. In its latest study, the company wanted to improve its estimates through an approach based on building a global balance sheet "analogous to the way a company constructs its balance sheet"4. The authors report that from 2000 to 2020, financial assets such as stocks, bonds, and derivatives grew from 8.5 to 12 times global GDP. Most importantly, real estate accounts for two-thirds of global real assets or net worth. The value of residential real estate, including land, stood at 46 per cent of global net worth in 2020, with buildings and land owned by corporations and public entities (state, municipalities) accounting for an additional 23 per cent.“Other fixed assets such as public infrastructure, machinery and equipment, intangible assets, and mineral reserves - the types of assets that typically drive economic growth - made up only a fifth of real assets or net worth, ranging from 15 per cent in the UK and France to 39 per cent in Japan.’
For its part, the German giant of the insurance sector, Allianz, made the following observation in September: “2020 was the year of extreme contrasts. The new SARS-CoV-2 virus has destroyed millions of lives and livelihoods, plunging the world economy into its deepest recession since World War II. At the same time, monetary and fiscal policy has mobilized unimaginable sums to support the economy, markets and people, with success. Incomes stabilized and stock markets recovered quickly. Global financial assets grew by + 9.7 per cent in 2020, reaching for the first time the magic mark of 200 trillion euros. The gap between wealth and economic growth has rarely been as pronounced as in 2020: Global financial assets have grown 11.6 per cent more than economic output. As a result, global financial assets passed another important milestone in 2020: for the first time, they exceeded 300% of global GDP”(emphasis added)5.
In the case of shares, the value of the assets is that of their stock market prices. The relation of the level of prices to economic reality is provided by the “Shiller index” (named after the Yale professor Robert Shiller who proposed it) which calculates the stock price/earnings ratio of listed companies. The principle of the CAPE ( Cyclically Adjusted Price to Earnings ) is as follows: to estimate whether the shares of listed companies are "too expensive" or not, you have to compare their price with their profits: this is the price/earning ratio or PER. But in order to be able to compare PERs over time, it is necessary to eliminate inflation and smooth out the effects linked to the economic cycle (profits are better when the economy is turned towards expansion, less good when it is depressed). The Shiller index thus relates the prices of the main 500 stocks on Wall Street (the S&P 500) to average earnings over periods of 10 years.
Graph 7
The Shiller index, share price/profits ratio of listed companies
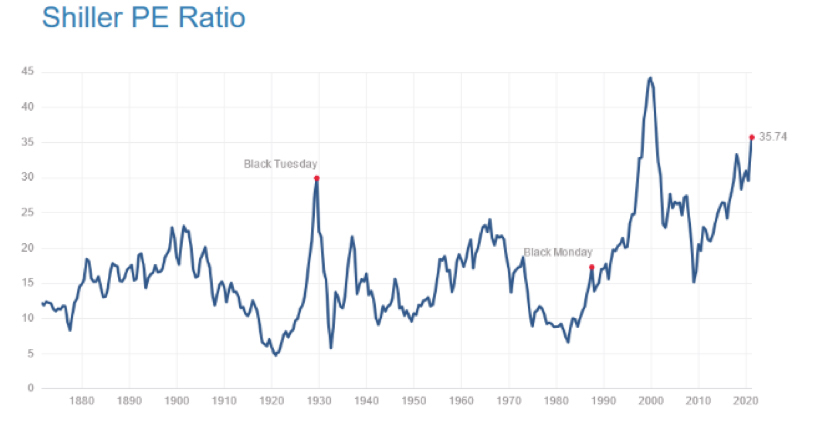
The index has reached its current level only twice, on the eve of the crash of 1929 and on that of the crash of dot.com shares on the Nasdaq in 2000. But in 1929 and to a lesser extent in 2000 the crashes put an end to real phases of capital expansion, whereas today we are in a phase of quasi-stagnation.
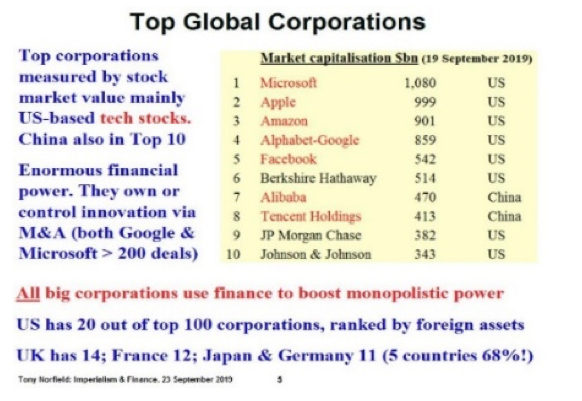
The index is calculated for the entire market, the total amount of shares traded. Its current level is based on two factors. The first is the level of market capitalization of the top ten listed companies (market capitalization being the number of shares of a company in circulation multiplied by the price of a single share). The sectoral distribution of 2019 is marked by the overwhelming domination of platforms based on artificial intelligence, the Internet and the sale of advertising (GAFAM). The situation is almost identical today, with the only new Top Ten entry on Wall Street being Tesla.
Graph 8
The top ten groups in terms of market capitalization
It is interesting to dwell for a moment on Tesla's entry into the Top Ten . Graph 9 provides a perfect illustration of a collective bet by financial investors as well as the type of operation that can make it possible to earn profits and support share prices. The CEO and main shareholder of Tesla is Elon Musk, also owner of the company SpaceX known worldwide for its plan to sell private space travel. Pioneer of electric-powered cars and designer and self-driving cars, Tesla was founded in 2003, but did not become eligible for inclusion in the S&P 500 and listing on the stock market on Wall Street until June, 2020 after four straight quarters of profit. It became the largest company ever listed on Wall Street and from the outset the sixth largest company in terms of market capitalization. As of June 2020, Tesla's market capitalization exceeded that of BMW, Daimler and Volkswagen combined. While the production and sale of the first of its four electric car models6. Tesla sold 473,136 electric cars in the first 8 months of 2021. More than any other electric vehicle maker in the world. Since 2009, Tesla has produced a total of 1.91 million vehicles. For its part, Toyota produced 8,800 in 2020 with a drop expected in 2021.]] is about ten times lower than that of Toyota, the world's largest producer, Tesla is present in the top ten capitalizations on the New York Stock Exchange and Toyota is not. Tesla has even allowed itself to raise some 12 billion shares through the sale of shares to finance mergers and acquisitions, while many companies are forced to buy their own shares to support the price.
Graph 9
Tesla, Revenue, Net Profit and Loss (2009-2020)
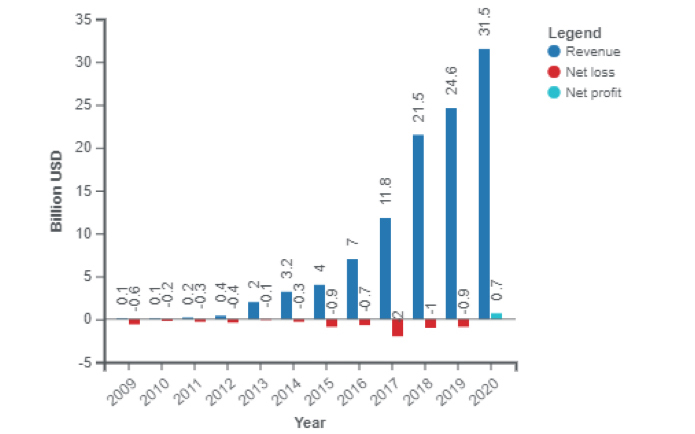
Tesla draws significant income from the sale of credits to other manufacturers. Many governments grant credits to manufacturers of battery electric vehicles based on the volume of their sales. These credits can in turn be sold to other manufacturers on the model of the carbon market and that of the sale of rights to pollute. In 2020, Tesla earned $1.6 billion from those sales, without which it would have had a net loss in 2020. In February 2021, a stock market checking document revealed that Tesla had invested some $1.5 billion in Bitcoin cryptocurrency, and the company has indicated that it will soon accept Bitcoin as a payment method. Tesla made more profits in 2021 from this investment than it did from profits from the sale of cars in 2020, due to the rise in the price of Bitcoin after the announcement of this investment.
Behind the movement of the Shiller index lies the conviction of investors that the Fed will come to the aid of the markets in the event of danger. The IMF is seriously concerned about this. In the introduction to the October report on global financial stability there is a warning, which the fall in share prices of November 26 justifies, as to the
"vulnerabilities of investment funds that manifested themselves during the 'dash for cash' race of March 2020 remain and risks increase in other non-bank financial institutions as they meet the targets of nominal yield. Some warning signs - for example, increased financial risk-taking and growing fragility in the non-bank financial institutions sector - point to a deterioration in the underlying foundations of financial stability. Thus, seeking to improve their return on investment, US and European life insurance companies have increased their share of lower quality bonds. In the current environment of persistently low interest rates and abundant liquidity, increased use of financial leverage to boost returns could lead to volatility in financial markets. Left unchecked, these vulnerabilities could become legacy structural problems, jeopardizing medium-term growth and straining the resilience of the global financial system.” 7
Now we will move from the financial sphere to that of production and consider a range of factors that affect the cost of living and give relevance to the slogan “against the high cost of living”, but from which we can make the hypothesis that they affect negatively the rate of profit, the movement of which will be recalled in the very last part of this note. The first factor is the rise in the prices of energy and raw materials. Let us start with the price of petrol. Today the new increase in the price of oil is largely the consequence of that of the price of other sources of energy - of coal in China and India, of natural gas in Europe.
Graph 10
Movement of natural gas prices in Europe
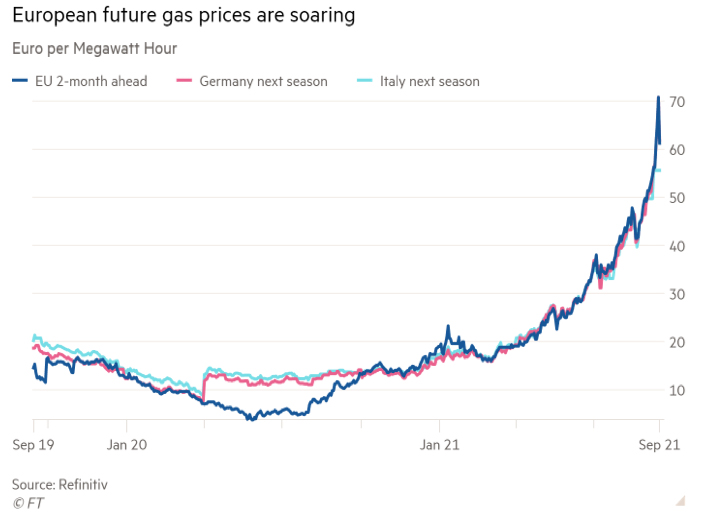
In France, October 1 , 2021 saw the biggest increase in the price of gas in the last 15 years with an increase of + 12.6 per cent. Since the start of 2021, the price of gas has increased by 57 per cent. The other European countries have experienced similar increases.
The price of gas on the wholesale market is reaching records because supply no longer meets demand, the whole being aggravated by speculation allowed by the financialization born of deregulation imposed by European treaties. From the 1990s, we went from an industry governed by public strategies to an industry where gas is a commodity governed by the spot market 8. On the demand side, the economic recovery in Asia due to the “end” of the pandemic triggered a mechanical increase in demand from the first quarter of 2021. The main world producers of liquefied gas transported by ship (the Gulf countries and the United States) have fuelled this recovery, benefiting from higher prices than in Europe. With a delay, the increase in gas demand was also due to the economic recovery, but in addition to the need to replenish European gas reserves. Indeed, last winter in Europe was long and various countries had to replenish their gas reserves for the winter of 2021-2022. Europe's largest national natural gas producer, the Netherlands, gradually began to shut down its main gas field in Groningen in 2018. Norway, which has become Europe's main gas supplier, suffered a major fire in its main gas liquefaction plant in September 2020. Since then, it has struggled to increase its gas deliveries to Europe. In addition, there is the policy of exporting gas by Russia, from where a large part of the gas entering Europe comes. As the world's largest producer, Russia is in a position to open or close the floodgates. It has limited its gas exports via Ukraine to obtain completion of the construction of the Nord Stream 2 gas pipeline, which the United States has strongly opposed.
Graph 11
Changes in world prices of major raw materials ( “commodities” ) since 1900
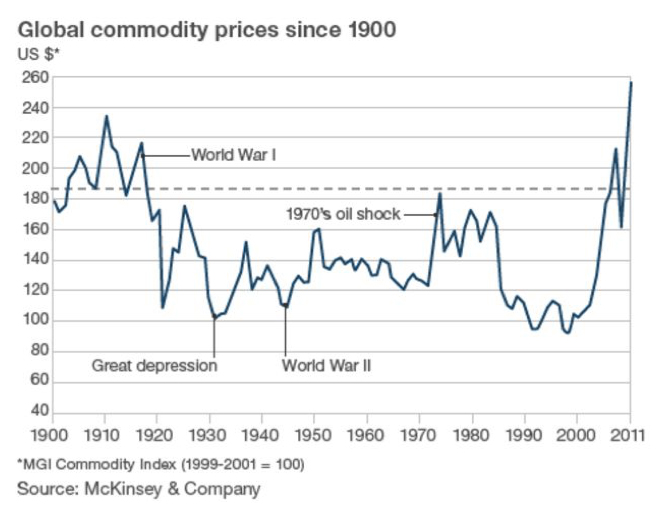
But behind this set of factors there is a long-term fundamental movement. A study on raw materials by McKinsey in 2013, from which graph 11 is drawn, notes that their movement has changed suddenly and dramatically since the early 2000s. During the twentieth century, their prices in real terms fell by just over half a percent per year on average. But from 2000, prices more than doubled on average. Second, price volatility has also increased considerably since the turn of the century. In fact, the supply of raw materials “seems to be progressively less able to adapt quickly to changes in demand because new reserves are more difficult and expensive to access. For example, offshore oil requires more sophisticated production techniques. The available arable land is not linked to the final markets due to lack of infrastructure. Mineral resources must increasingly be developed in areas of high political risk. These factors not only increase the risk of supply disruptions, but also make the supply even more inelastic. As supply becomes increasingly insensitive to demand, even small changes in that demand can lead to large changes in prices. Investors may be deterred by the volatility of resource prices and become less inclined to invest in new initiatives concerning supply or resource productivity."
Third, the prices of different types of raw materials are increasingly closely correlated. First, resources represent a significant proportion of the input costs of other resources. For example, rising energy costs in fertilizers lead to higher production costs in agriculture. Second, technological advances allow a greater degree of substitution between resources in final demand; for example, biofuels link agriculture and energy markets9. There is therefore a serious threat to agricultural production, since the supply of foodstuffs is undergoing a process of reduction in favour of their use as a fuel whose effects combine with those of climate change.
The FAO has published a graph showing the increase in the price of five major groups of products over the past two years (Graph 12). But this is not a recent phenomenon10. Indeed, the real average price of food has been rising since 2000, reversing the downward trend that began in the 1960s.
Graph 12
Price movements of five major groups of agricultural products
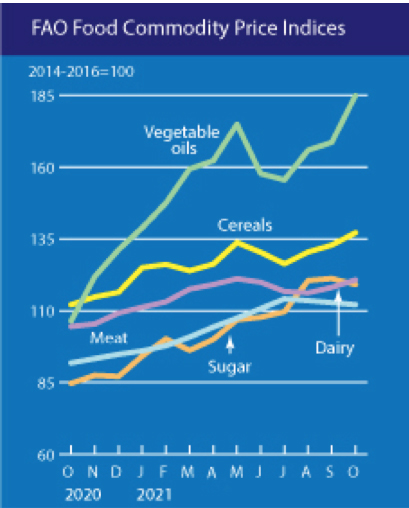
No single product was responsible for this increase. Regarding the latter two, the edible oil crop price index increased significantly, mainly driven by vegetable oil prices which soared by 16.9 per cent between 2019 and 2020, this increase being due to unfavourable weather conditions but also to the increase in demand for biodiesel. We are therefore dealing with competition between two finalities arbitrated by the large agro-industrial groups. The other food category with the biggest effect on rising food prices is sugar: frost damage in Brazil in July due to climate change reduced supply and inflated prices. Wheat, barley, maize, sorghum and rice provide at least 50 per cent of the world's diet, and up to 80 per cent in the poorest countries. Global stocks of these crops that have helped stabilize global markets have been declining since 2017 as supply no longer meets demand. The price increase has accelerated sharply since 2019; one thing '”deserving of attention is the number of times since 2000 where 'unforeseeable' and ‘adverse' weather conditions have been reported by the FAO as a cause of' ‘reduction in crop expectations', 'weather-affected crops' and ‘decline in production'”.
In the short term, according to the McKinsey study on major commodities, the world economy is not faced with situations of absolute scarcity. On the other hand, “ the rise in marginal supply costs seems to be omnipresent and to put a floor under the prices of many basic products ”. The need to look for ever more expensive deposits located in regions of high political risk weighs on profit prospects. It is interesting to note that when it comes to basic products, the study does not expect any new technological breakthrough that could counteract the underlying trends.
When we turn to technologies that are materialized in the manufacturing and service sectors, the index of total factor productivity growth shown in Graph 13 suggests that in manufacturing and service industries, robotics and artificial intelligence have little capacity to improve profit prospects overall, even though specific companies have been able to take advantage of them.
Graph13
Total factor productivity growth index for five countries
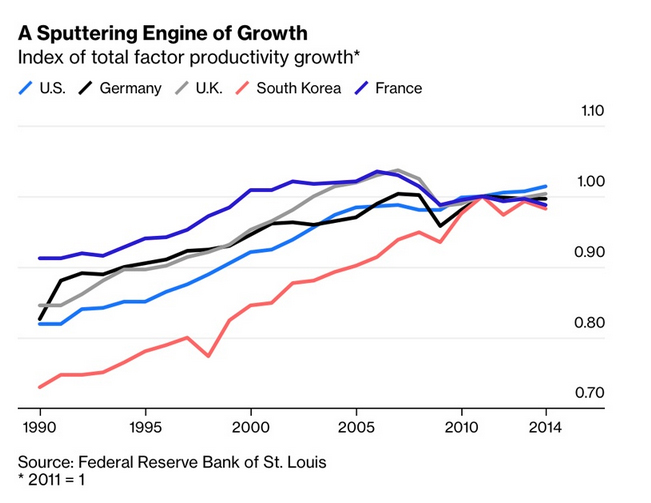
Source : Noah Smith http://www.blo…
When we turn to technologies that are materialized in new products (product technology), their ability to open up profit prospects for a large number of companies and to serve as a stimulus to accumulation depends on the magnitude of the demand that their social utility allows them to create, as does the amount of investments that their introduction supposes, both in the industrial branch where they originate or whose creation they require, and in related neighbouring branches. Technologies that have emerged roughly over the past two decades have been scrutinized by US economist Robert Gordon in research published in 2012 and 2016. Gordon takes as a point of comparison "the three most basic 'general purpose technologies'. of the second industrial revolution (started in the 1890s and extending into the 1970s, FC) which gave birth to dozens of life-changing inventions ”were electricity, the internal combustion engine and the cordless telephone11.
Closer to home, information and communication technologies (ICT) led in the second half of the 1990s to a momentary recovery in productivity growth, due to an unprecedented drop in the cost of speed and the memory capacity of computers, as well as an unprecedented increase in the share of GDP devoted to investment in R&D and initial IT equipment. The advances made from the late 1980s to the 2001 crash of the dot.com bubble are going to be hard to surpass. Gordon examines the latest advances in small robots, artificial intelligence, 3D printing and driverless vehicles and estimates that their macroeconomic effects are going to be very small. Today, the launch of investments and measures to boost production in a series of industries, necessary to slow down global warming, could meet the criteria defined above.
Another factor affecting the rate of profit of a growing number of companies is constituted by delivery delays and bottlenecks in global supply chains. It is agreed between researchers that these have revealed their great fragility during the crisis resulting from the pandemic [[https://alenco…]]. But we can measure their importance thanks to an index constructed by the IMF through surveys of purchasing managers who are asked if the delivery times are on average longer, faster or unchanged compared to the previous month. In Graph 14, ratings above 50 indicate faster delivery times and those below 50 indicate longer delivery times12. Delivery delays and component bottlenecks weigh on the production of the goods (commodities) of which they are inputs. They reinforce, underlines the IMF, in configurations of oligopoly or monopoly, the power of the sellers. This dimension is crucial. Robert Reich argues that as far as the United States is concerned, price inflation is a symptom of a deeper structural problem: the growing consolidation (centralization/concentration) of the economy in favour of a handful of large firms with enough power to increase prices and profits13.
Graph 14 Backlogs and Bottlenecks in Global Supply Chains
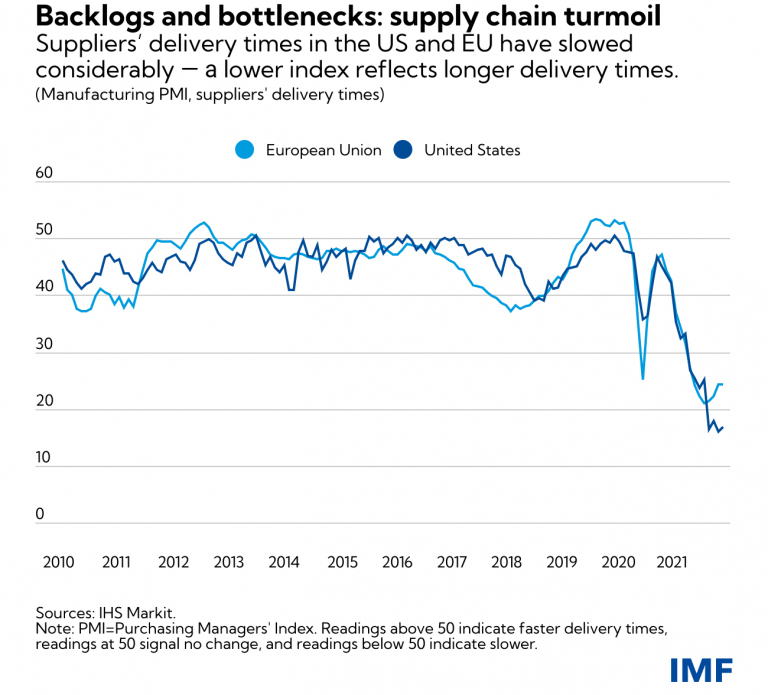
In terms of delivery delays, we find the situation where Chinese manufacturing industry has recovered faster than expected after its 2019-2020 decline, but where shipping companies had already put container ships in dry dock. A shortage of shipping containers, essential to supply chains, is contributing to the disruption. Containers normally circulate around the world, but due to gross mismanagement “many are now stuck in North America: for every 100 containers that arrive there, only 40 are sent back to Asia or Europe. Surplus containers are piling up in Los Angeles and other US ports while Chinese suppliers fight for them. It will be months before container manufacturers increase production capacity and meet demand”14.
The most spectacular and serious bottleneck is in the production of microchips in Taiwan. The manufacture of semiconductors requires a great deal of water, especially for cleaning the chips. A single production plant can use 2 to 9 million gallons (1 US gallon = 3.78 litres) of water per day. Intel, the world's largest semiconductor maker, absorbed 9 billion gallons of water in 2015 (Intel Corporate Responsibility Report 2015), the equivalent of about 75,000 American homes. Problems with the water supply can dramatically reduce plant performance or require a plant to shut down15. Global capitalism has placed itself in a situation of unparalleled dependence on a Taiwanese group, the Taiwan Semiconductor Manufacturing Company (TSMC), the world's largest semiconductor manufacturer, and hence on the climatic conditions on the island16. Communication equipment (Internet boxes, computers, laptops) were the first to be affected by this shortage. But the automobile industry is the most serious victim, with a greatly slowed down production. In the US case, General Motors and Ford were forced to temporarily close several factories or to reduce production. Taiwan is normally one of the wettest places in the world, with an average of 2,600 millimetres of precipitation per year. The island is normally swept during the rainy season by typhoons which help to fill the reservoirs. The longer the drought lasts, the more difficult it will be to produce, so some companies are asking for the creation of state reservoirs to store more water and anticipate a recurring risk due to global warming.
The succession of factors examined in the commentary on Charts 9 to 14 gives a concrete character to the discussion on the fall in the rate of profit, with which we will end. We have seen specific factors affecting profitability. I am borrowing Graph 15 from Michael Roberts, who very regularly updates the evolution of the rate of profit in the United States.
Chart 15
Rate of profit in the USA (calculation by Michael Roberts)
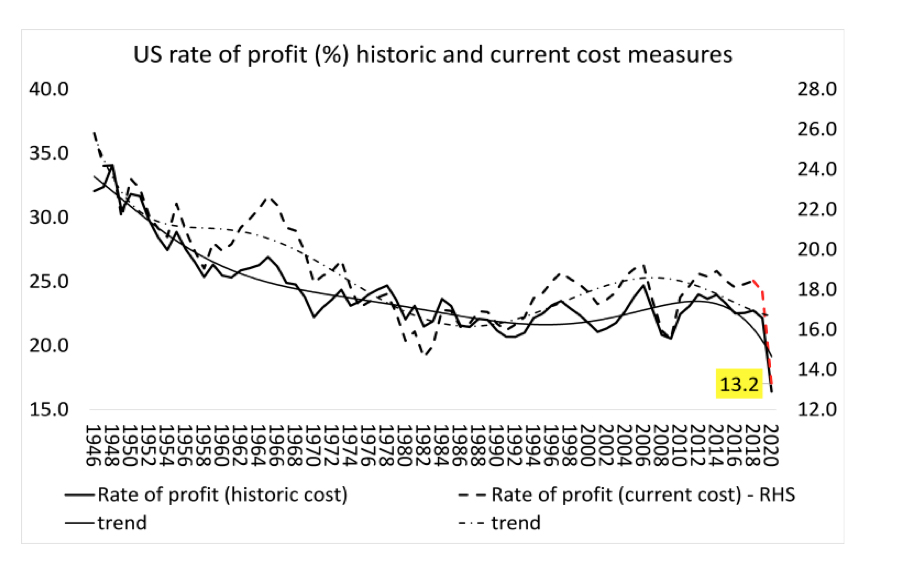
Roberts attributes the fall in the US rate of profit to the rise in the organic composition of capital by nearly 17 per cent, surpassing the rise in the rate of surplus (3 per cent).
Graph 16
Changes in the organic composition of capital (calculation by Michael Roberts)
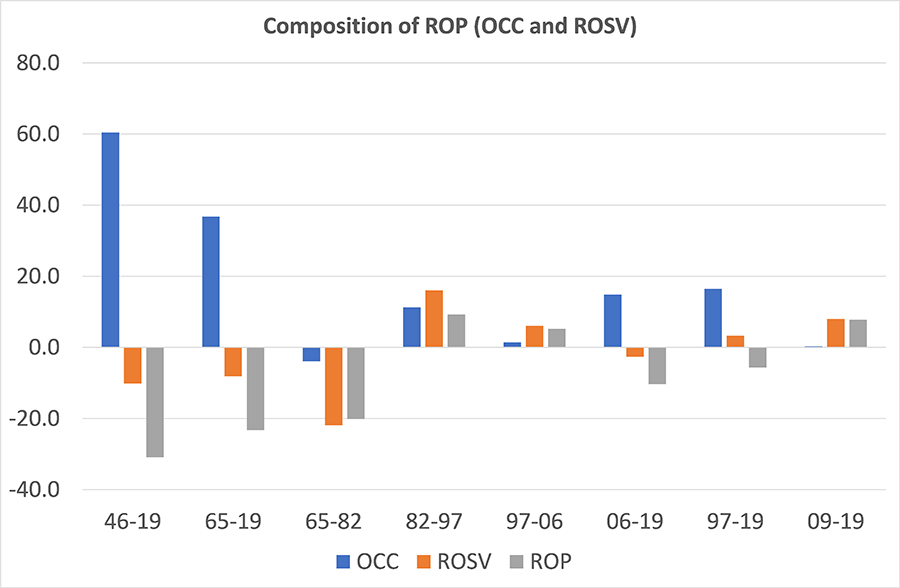
(OCC = organic composition of capital, ROSV = rate of surplus value)
Let us recall that the organic composition is a ratio between the capital invested by companies in physical form, which does not create value but only transmits it, hence the name constant capital, and variable capital, namely labour power. purchased by companies that create value, the amount of which depends on its productivity. When this ratio increases, the rate of profit decreases. Two remarks are in order. The first is the need not to make it an ahistoric process. Roberts writes: “ It is a law in capitalist economic expansion that this ratio, called the organic composition of capital, increases”17. But does it still have the force of a law when capitalism is in decline? To ask this question is to open a discussion going well beyond the purposes of this note. On the other hand, what can be done is to establish the list of factors to be taken into consideration and to examine them concretely. This is the case today for the input component to the production of constant capital. There must be included in constant capital: 1) the price of machines as they are at a given time, therefore today computers as well as machine tools, 2) the price of premises, therefore today factories but also offices, 3) the price of energy and raw materials both in aggregate and critical inputs (chips). However, these have been largely neglected by researchers . Today, for the reasons we have just seen, this constant capital contributes to the rise in the ratio and will continue to do so.
The second remark concerns the notion of factors counteracting the effect of the increase in the organic composition c/v which in many texts Roberts greatly simplifies. This factor is a composite of the amount of capital invested in the purchase of labour power and the amount of surplus value or surplus labour obtained by putting it to work in workshops and offices, the amount invested being a function of both prospects, profitability (the interest that companies have in investing), and the price at which this purchase takes place due to the general level of aggregate productivity, the first determinant of the price of what is necessary for the reproduction of labour power at a given historical moment. So there come into play production technologies (today AI and robotics), the efficiency of management methods, the weight of the industrial reserve army (the mass of the unemployed); the fighting capacity of workers (to overcome the obstacle of the trade-union leadership, to engage in mobilizations that thwart anti-union offensives and to find new forms, for example the Yellow Vests in France, strikes in the logistics sector or the strike movement at GKN in Italy, internationalized strikes by Amazon employees, strikes at John Deere and in the health sector in the United States, etc.). Let us insist on the fact that the amount of labour power actually purchased, one of the factors affecting c/v, depends on the interest that companies have in investing, and therefore on the expected profit. However, this is declining, as shown in Graph15, an additional indicator being the downward movement of investment, and cycles whose duration has shortened.
Chart 17
Net private investment in the United States as a percentage of GDP (1980-2016)
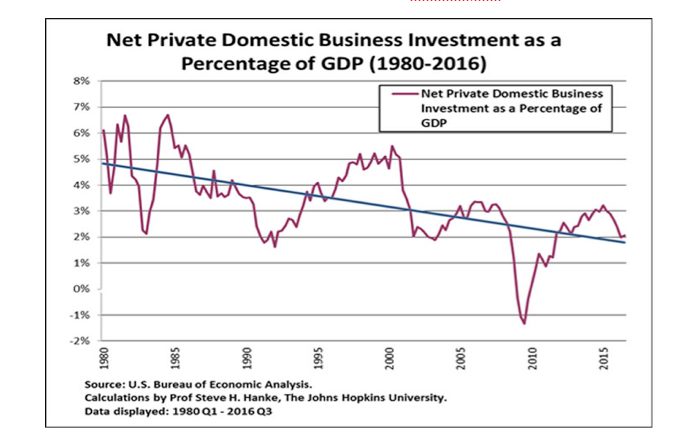
According to the calculations of the latest McKinsey study, “ over the past two decades net investment as a percentage of GDP has been low and declining, especially in advanced economies, contributing only 28 per cent to the expansion of net worth. Asset price increases accounted for 77 per cent of the growth in net worth, and more than half of these increases were greater than general inflation18.
At the end of the period, according to IMF figures, the US movement was part of a global movement affecting a set of countries.
Graph 18:
Global investment in machinery and global expenditure on durable consumer goods (start of 2016 to end of 2019)
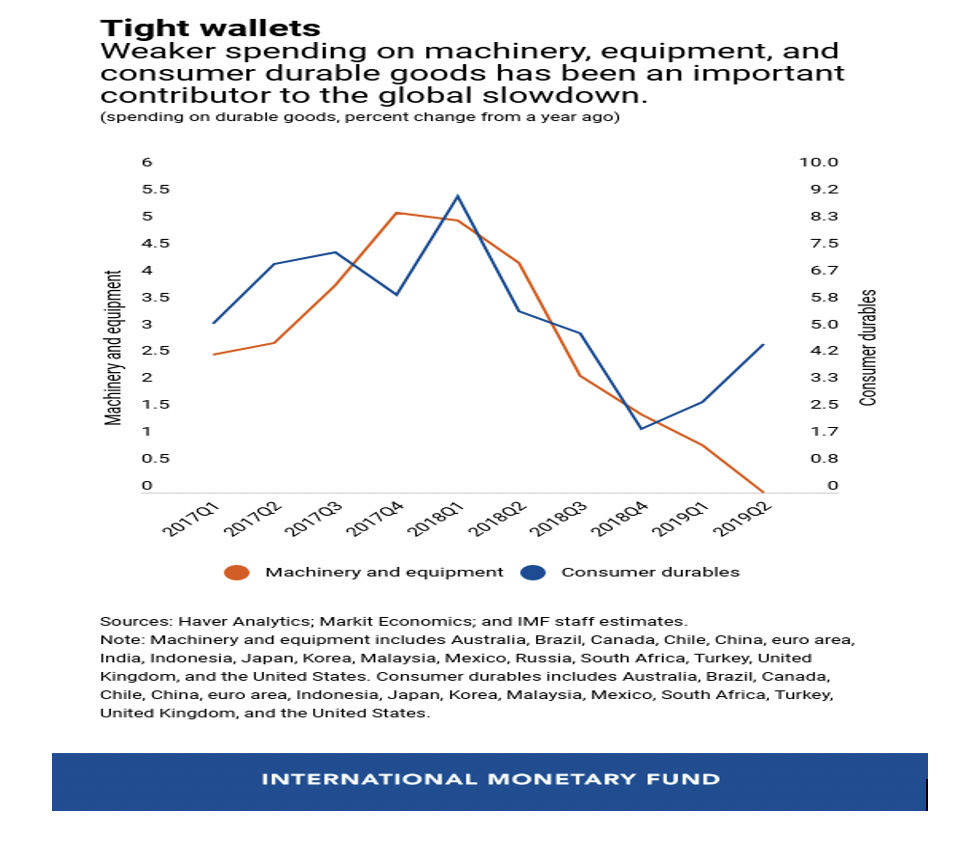
At the end of the period, according to IMF figures, the US movement was part of a global movement affecting a series of countries.
It is in this context that the announced bankruptcy of the giant real estate developer Evergrande is taking place19.The group is one of those designated by the term “too big to fail” . Its financial rescue and partial restructuring/dismantling are underway. The Evergrande situation is the tip of the iceberg of a turnaround in the real estate market, illustrated by Graph 19.
Graph 19
The great slowdown in the Chinese real estate market
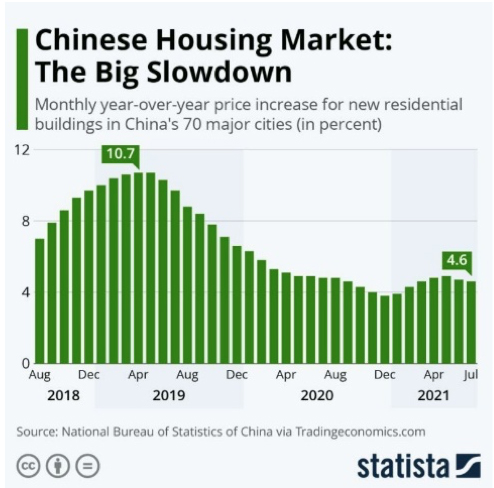
As Romaric Godin writes, “ much more than a global financial contagion, what threatens the world economy is the slowing down of one of the lungs of growth, China. The slowdown in growth and the effect of this bankruptcy on domestic demand are likely to weigh heavily, while for 30 years Chinese growth has been pulling the rest of the world. Between 2013 and 2018, China directly contributed 28 per cent of global growth. This figure is undoubtedly even stronger when we add the effect of Chinese investments abroad, even beyond this crisis. ” And he continues: “ Evergrande appears as a symptom of a Chinese economy which, is already not able, short of launching into bubbles, to generate strong growth. It is confronted, after 30 years of growth, with the same problems as the Western economies: an inability to generate sufficient productivity gains for a balanced capitalist development. Even though Beijing has the means to moderate the effects of this underlying crisis, the Chinese regime has scarcely more solutions to this structural problem of contemporary capitalism than its Western or Japanese peers. This convergence undoubtedly signals the end of an era. From now on, the drivers of growth will be weak or very risky. A new regime of weak growth is shaping up, in which the pressure on labour and nature will necessarily increase. Instability undoubtedly threatens China, but not only China. "
By way of conclusion
A "weak growth regime", accompanied in addition by a tendential movement of rising prices for energy and major raw materials, is conducive to the exasperation of the reflex "everyone for themself", as well as to the unleashing of international competition. These elements hovered over COP26 in Glasgow, from which countries in dire need of financial assistance left, to their great dismay, empty-handed. At the domestic level, in Europe the only response so that “everyone for themself” does not accentuate racist and xenophobic reflexes even more, and in order to safeguard the basic living conditions of workers, is to put forward the political struggle against the cost of living and the forces responsible for it.
29 November 2021
Published in French on the site alencontre.org, 30 November 2021.
François Chesnais is professor emeritus at the University of Paris 13-Villetaneuse. He is a member of the Scientific Council of ATTAC-France.
- 1https://blogs.imf.org/2021/10/12/a-hobbled-recovery-along-entrenched-faultlines/?Utm_medium=email&utm_source=govdelivery
- 2Global Financial Stability Report, October 2021 - Executive Summary; October 12, 2021, p.1.
- 3Romaric Godin and Dan Israel , “Reprise économique: le récit gouvernemental se heurte a la réalité”, {Médiapart} , September 2, 2021.
- 4https://www.mckinsey.com/industries/financial-services/our-insights/the-rise-and-rise-of-the-global-balance-sheet-how-productively-are-we-using -our-wealth?
- 5https://www.eulerhermes.com/en_global/news-insights/economic-insights/Allianz-global-wealth-report-2021.html
- 6https://ir.tesla.com/press-release/tesla-q3-2021-vehicle-production-deliveries
- 7Global Financial Stability Report, October 2021 - Executive Summary; October 12, 2021, p.3.
- 8See Aurélien Bernier, “Prix de l’énergie: une folie organisée”, {Le Monde diplomatique}, November 2021.
- 9https://www.mckinsey.com/business-functions/sustainability/our-insights/resource-revolution-tracking-global-commodity-markets
- 10Alastair Smith, “Food : Why this record increase in world prices?”, {The Conversation}, October 3, 2021.
- 11Robert J. Gordon “Is US Economic Growth Over? Faltering Innovation Confronts the Six Headwinds,”NBER Working Paper 18315, August 2012. Robert J Gordon, “The Demise of US Economic Growth: Restatement, Rebuttal, and Reflections”, NBER Working Paper No. 19895, February 2014, https: // www.nber.org/papers/w19895.pdf
- 12https://blogs.imf.org/2021/10/25/longer-delivery-times-reflect-supply-chain-disruptions/?utm_medium=email&utm_source=govdelivery
- 13https://alencontre.org/ameriques/americnord/usa/etats-unis-debat-nous-devons-parler-de-la-veritable-raison-de-linflation.html
- 14https://foreignpolicy.com/2021/10/27/china-supply-chain-disruption-shipping/
- 15https://digital.hbs.edu/platform-rctom/submission/taiwan-semiconductor-manufacturing-cos-water-woes/
- 16https://www.lunion.fr/id251461/article/2021-04-23/penurie-mondiale-de-puces-electroniques-la-secheresse-historique-taiwan-narrange
- 17Michael Roberts, “Marx's law of profitability”. Lecture in the series of seminars on Marxist political economy organized by the Department of Development Studies at the School of Oriental and African Studies (SOAS). Michael Roberts Blog, 27 February 2020. The text of the lecture is accompanied by a long Powerpoint presentation.
- 18https://www.mckinsey.com/industries/financial-services/our-insights/the-rise-and-rise-of-the-global-balance-sheet-how-productively-are-we-using -our-wealth?
- 19https://en.wikipedia.org/wiki/Evergrande_liquidity_crisis